
Data released at the weekend showed China’s exports fell 1.1% y/y in
November, the fourth consecutive month of negative growth. It is evident that
the 18-month tariff was with the US is taking its toll on China’s export sector
and could imply that they may be more ready to get a Phase 1 deal signed off as
soon as possible. That might be construed as positive for risk, but the headline
data is dominating sentiment for the time being.
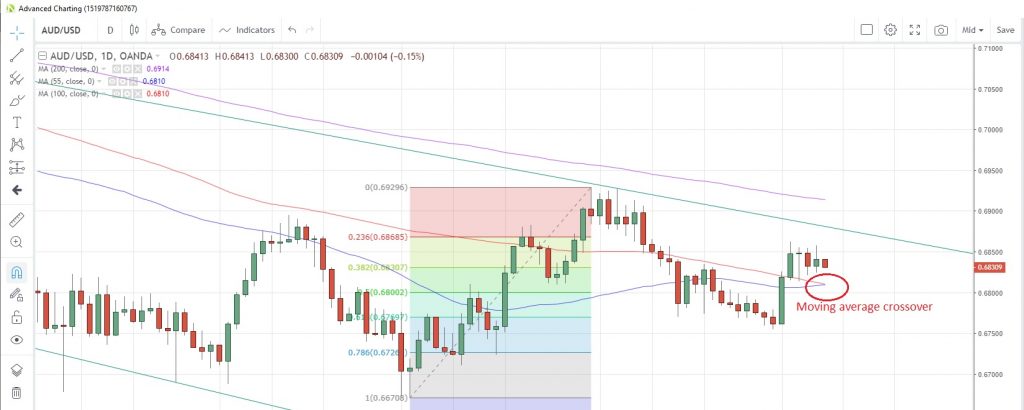
Imports came in better than expected, rising 0.3% y/y versus the -1.8% expected and as a result the trade surplus narrowed to $38.7 billion. The Australian dollar was buoyed by the US payrolls data but has started the week in the red after the poor China trade data. The weak imports growth being one of the driving forces. The 55-day moving average looks poised to rise above the 100-day moving average at 0.6810 for the first time since February 8.
Imports came in better than expected, rising 0.3% y/y versus the -1.8% expected and as a result the trade surplus narrowed to $38.7 billion. The Australian dollar was buoyed by the US payrolls data but has started the week in the red after the poor China trade data. The weak imports growth being one of the driving forces. The 55-day moving average looks poised to rise above the 100-day moving average at 0.6810 for the first time since February 8.
AUD/USD Daily Chart

Source: OANDA fxTrade
No comments:
Post a Comment