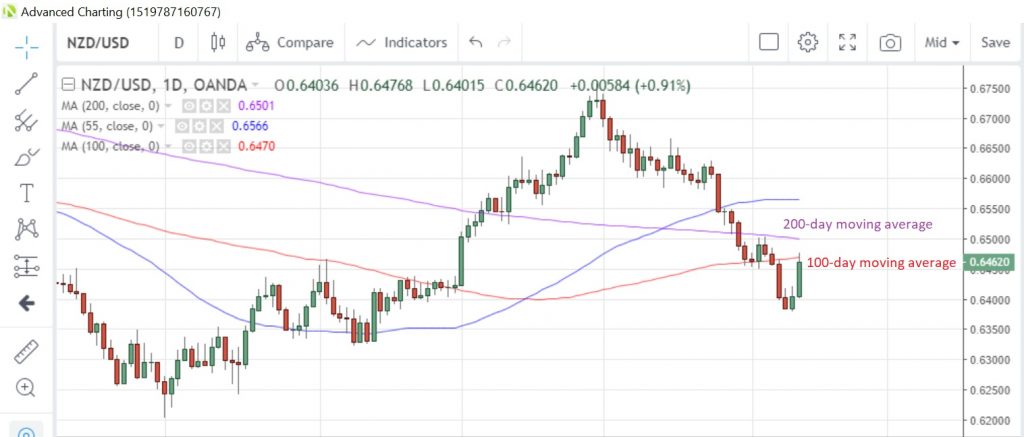
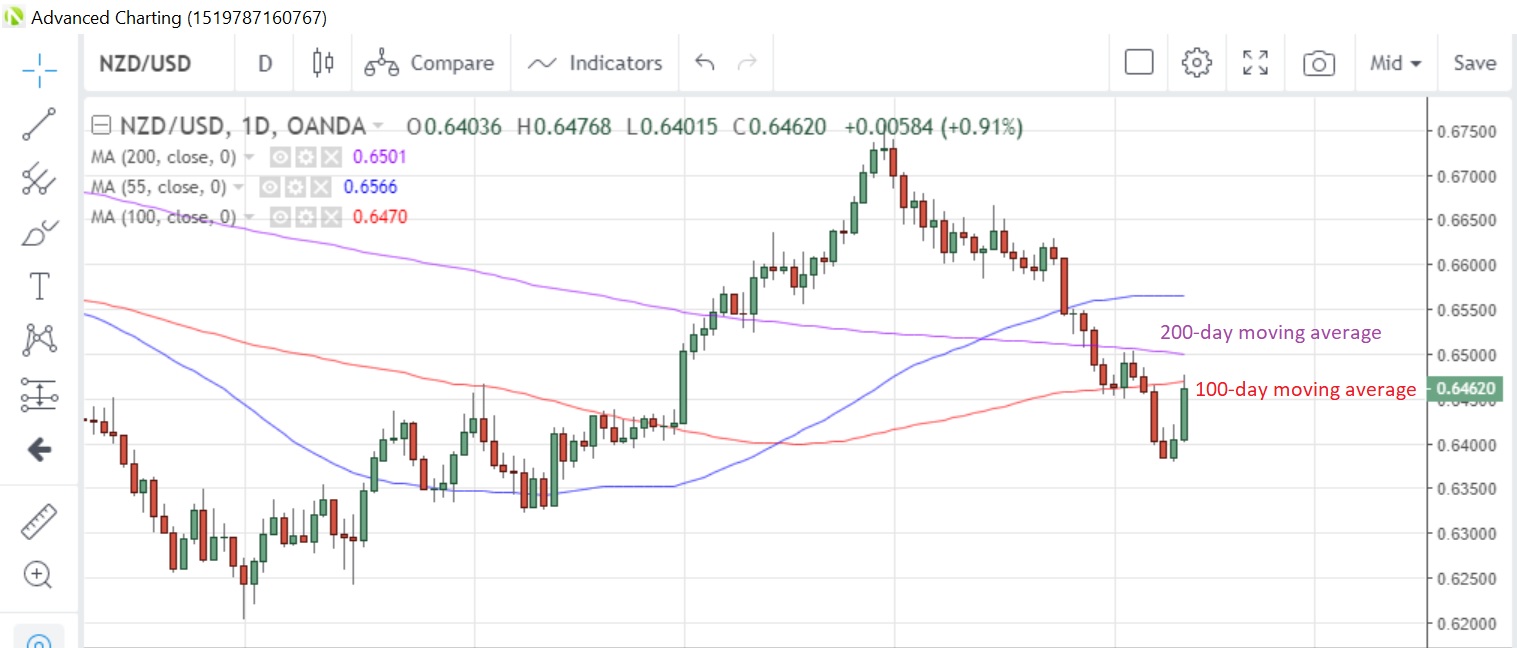
NZD/USD rose the most since December 2 and tested the 100-day moving average
at 0.6470. The 200-day moving average sits above at 0.6501.
NZD/USD Daily Chart
NZD/USD Daily Chart

Forex and stock traders are looking for the consistently wrong investor, trader and take the opposite position. This will obviously lead to winning trades for them. All traders have read trading books that point out that increasing volume is good for the continuation of the trend. Many new stock traders will try and fight the trend.
| The following assumptions that have been made: - At least 20 pip forecast - The key level and chart pattern were at most 5 candles apart at time of identification | ||
Symbol : EURZAR  | ||
| Direction : Identified time : 2020-02-10 16:01 GMT Breakout price : 16.40575 Forecast price : 16.3737 Forecast pips : 321 Probability : 61.34 % | ||
|

