Sunday, December 15, 2019

100 GBP Daily Chart forex 12/15

UK100GBP Daily Chart


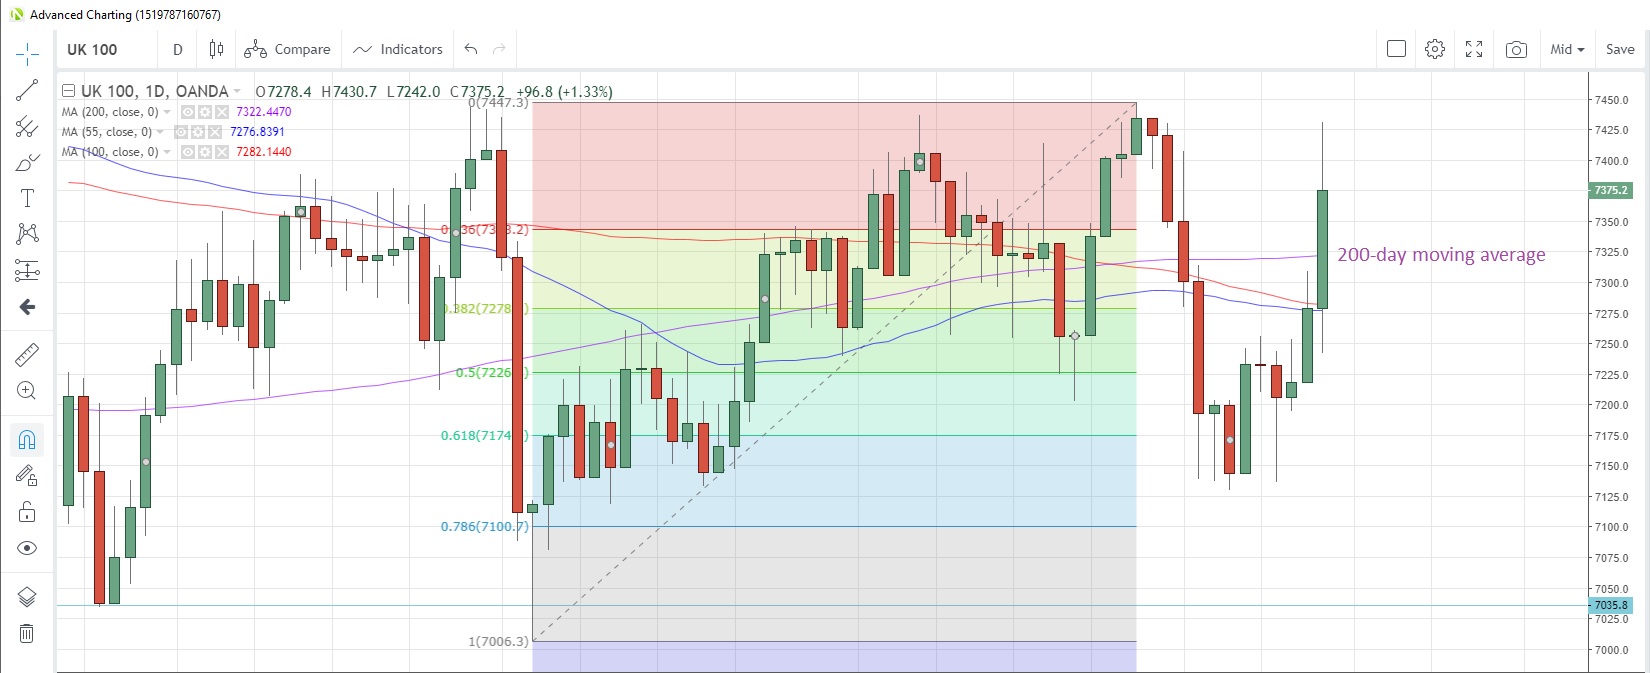
Source: OANDA fxTrade


  • UK shares jumped the most since the end of July on Friday after Boris Johnson’s Conservative Party’s resounding election win made the January 31 Brexit deadline clearer and more of a reality. No doubt there still remains a lot of negotiating to be done
  • The index spiked to the highest in just over two weeks and closed above the 200-day moving average for the first time since November 29
  • The Markit flash manufacturing PMI is expected to rise to 49.4 in December from 48.9 the previous month.

Friday, December 13, 2019

forex fundamental analyst and the technical analyst


The fundamental analyst and the technical analyst a trader who studies charts share the same goal. Both seek to project the future. Their methods are also quite similar in many respects. A fundamental analyst might look at Apple (AAPL) and try to project how many iPhones and iWidgets will be sold next quarter, and how that will influence profits, growth, and profits. Then the trader takes all his research numbers and derives a projection of the company's outlook largely based on what's happened in the past. Professional Techniques For Short-Term Currency Trading

British pound 12/13 forex

The British pound rose sharply overnight, and the WSJ Dollar Index, which measures the U.S. currency against a basket of 16 others, was recently down 0.3%. That makes dollar-denominated oil is less expensive for other currency holders.

Despite a combination of bearish U.S. oil inventory data and forecasts for stubborn oil gluts in early 2020 so far this week, Friday's gains mean Brent crude and U.S. crude have risen 7.7% and 4.9% respectively so far this month.

Both benchmarks received a boost last week when OPEC and its allies completed a new production deal to deepen cuts by a total of 1.7 million barrels a day to last through the end of March.

The impending change in the amount of sulfur allowed in marine fuel oil, known as 'IMO 2020', due to take effect at the end of the month was also boosting Brent and U.S. crude prices, with lower sulfur fuel tending to be taken from sweeter crude oil varieties.

Thursday, December 12, 2019

forex GBP/JPY chart 12/12


The following assumptions that have been made:
- At least 20 pip forecast
- The key level and chart pattern were at most 5 candles apart at time of identification


Symbol : GBPJPY   


Direction :
Identified time : 2019-12-12 20:01 GMT
Breakout price : 143.603
Forecast price : 143.8589
Forecast pips : 26
Probability : 59.74 %
Pattern : Triangle
Interval : 30 Min

Pattern : Triangle
Interval : 15 Min

Pattern : Resistance
Interval : 30 Min

forex EUR/CAD chart 12/12


The following assumptions that have been made:
- At least 20 pip forecast
- The key level and chart pattern were at most 5 candles apart at time of identification


Symbol : EURCAD   


Direction :
Identified time : 2019-12-12 13:45 GMT
Breakout price : 1.46887
Forecast price : 1.47089
Forecast pips : 20
Probability : 62.04 %
Pattern : Ascending Triangle
Interval : 15 Min

Pattern : Resistance
Interval : 15 Min

Pattern : Resistance
Interval : 15 Min